
📈 Evaluation
We will use the following four evaluation metrics to assess the performance of the algorithm, which together form the final scoring formula:
Dice Similarity Coefficient (DSC): Quantifies the overlap between the predicted segmentation result and the ground truth, with a value range of 0–1. Higher values indicate better consistency between the two segmentations.
Normalized Surface Distance (NSD): Evaluating medical image segmentation performance that measures the overlap between predicted and ground truth segmentation surfaces at specified tolerance distances.
F1-score: Measures the comprehensive accuracy of a classification model, calculated as the harmonic mean of Precision (positive predictive value) and Recall (true positive rate). It balances the two metrics, making it suitable for imbalanced datasets, with a range of 0–1 and higher values meaning better performance.
Processing Time: Our time score is obtained using min–max normalization. We set two time thresholds (an upper and a lower bound) to prevent extreme values from causing fluctuations in the normalization process, ensuring that the time score is evaluated within a stable range.
🏇 Ranking Methods
The final ranking is determined by a weighted combination of segmentation score($S_{\text{seg}}$), classification score($S_{\text{cls}}$), and processing time score($S_{\text{time}}$),with the scores of the three parts accounting for 40%, 40%, and 20% respectively.The overall score is calculated as follows:
$$ S_{\text{total}} = 0.4\,S_{\text{seg}} + 0.4\,S_{\text{cls}} + 0.2\,S_{\text{time}} $$1. Segmentation Score: $ S_{\text{seg}} $ is calculated based on longitudinal view scores and transversal view scores, denoted as $ S_{v(v ∈ \{long, trans\})} $ , each contributing 50% to the overall score. $ S_{\text{v}} $ is derived from the plaque segmentation score $ S_{v,plaque} $ and the vessel segmentation score $ S_{v,vessel} $ . Given that accurately identifying plaque contours holds greater clinical significance than vessel segmentation, weights of 60% and 40% are assigned to $ S_{\text{v,plaque}} $ and $ S_{v,vessel} $ , respectively. $ S_{\text{v,plaque}} $ is composed of plaque Dice Similarty Coeticient $ DSC_{\text{v,plaque}} $ and plaque Normalized Surface Distance $ NSD_{\text{v,plaque}} $ , both of which accounted for 50%. Similarly, $ S_{\text{v,vessel}} $ is composed of the Dice Similarity Coefficient for vessels $ DSC_{\text{v,vessel}} $ and the Normalized Surface Distance for vessels $ NSD_{\text{v,vessel}} $ , also weighted equally at 50%. The specific calculation formula for $ S_{\text{seg}} $ is as follows:
$$ S_{\text{seg}} = \frac{1}{2} \sum_{v \in \{\text{long},\,\text{trans}\}} \Big( 0.4\, S_{v,\text{vessel}} + 0.6\, S_{v,\text{plaque}} \Big) $$ $$ S_{v,\text{vessel}} = \frac{DSC_{v,\text{vessel}} + NSD_{v,\text{vessel}}}{2} $$ $$ S_{v,\text{plaque}} = \frac{DSC_{v,\text{plaque}} + NSD_{v,\text{plaque}}}{2} $$2. Classification Score: $S_{cls}$ is computed based on the total number of classes ( $ N $ ), defined as the average F1-score across all classes. The calculation formula is as follows:
$$ S_{cls} = \frac{1}{N} \sum_{i=1}^{N} F_{1_i} $$3. Processing Time Score: $S_{time}$ is calculated based on the participant's inference time $ T_{user} $ relative to the baseline time $ T_{baseline}$. The scoring rules are as follows:
- Case 1: When the input data contains values both below $\frac{1}{3}T_{baseline} $ and above $2T_{baseline} $, the adjustment function uses fixed thresholds where $T_{min} = \frac{1}{3}T_{baseline} $ and $T_{max} = 2T_{baseline} $, clamping all user times to this standard range.
- Case 2: When the input data contains values below $\frac{1}{3}T_{baseline} $ but none exceed $2T_{baseline} $, the lower boundary is set to $T_{min} = \frac{1}{3}T_{baseline} $ while the upper boundary adapts to $T_{max} = \max{(T_{user})} $ .
- Case 3: When the input data contains no values below $\frac{1}{3}T_{baseline} $ but has values exceeding $2T_{baseline} $, the upper boundary is fixed at $T_{max} = 2T_{baseline} $while the lower boundary adapts to $T_{min} = \min{(T_{user})} $ .
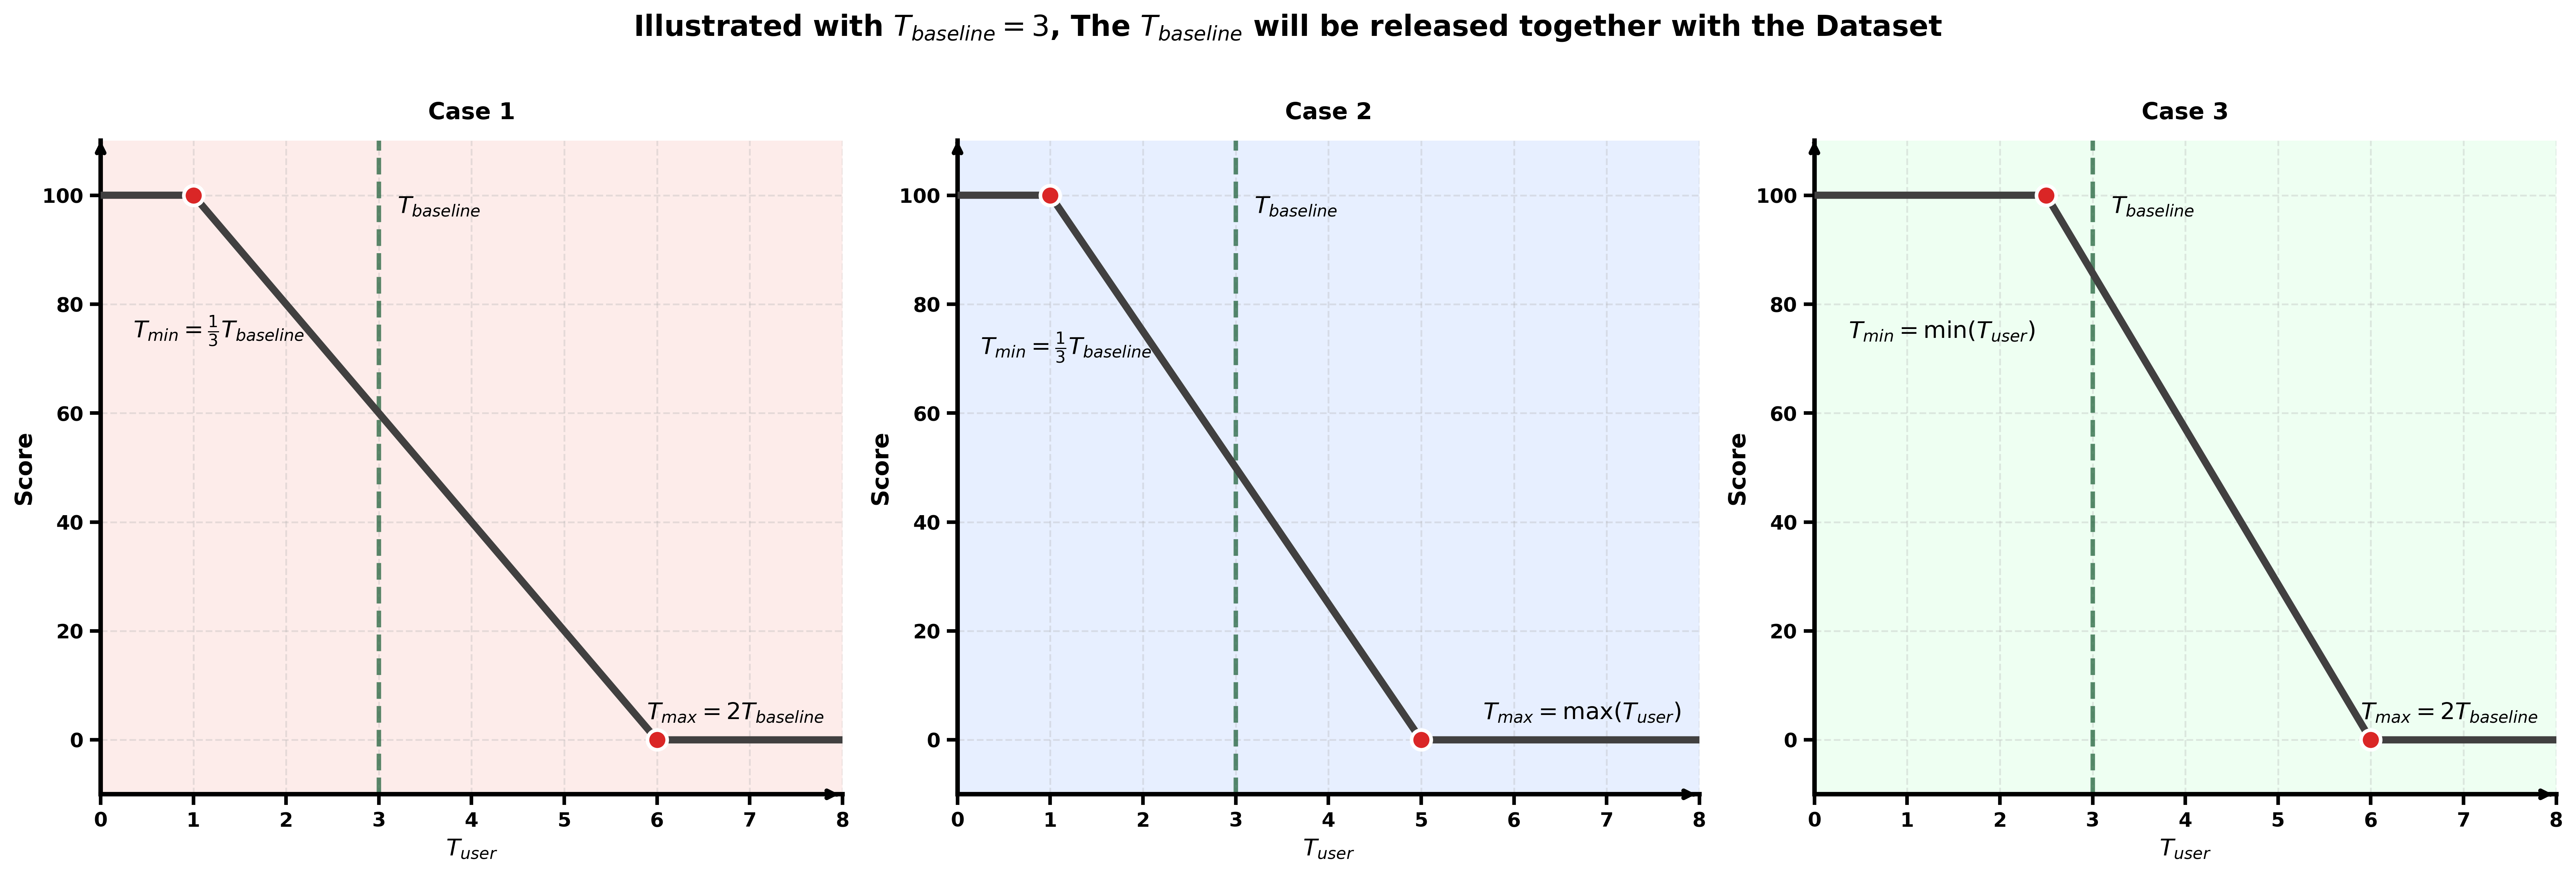
After applying min-max normalization to the participants' converted scores $ T_{user} $, a score within the [0, 100] range is obtained. The specific calculation formula for $S_{time}$ is as follows:
$$ S_{time} = \frac{T_{max} - T_{user}}{T_{max} - T_{min}} \times 100 $$